A new approach to quantify the sources of pollutants (etc.) in rivers
Published:
How can we determine where a pollutant, and in what quantities, enters a river network? In two recently published papers my collaborators and I describe a new mathematical ‘inverse’ approach to solve this problem. We then use this technique to determine how chemicals such as illegal drugs and pesticides enter the River Wandle, a chalk stream in SW London, through both treated and untreated wastewater.
The problem
Pollution is the main reason rivers are in poor condition
Currently, only 14% of rivers in England meet ‘good’ ecological status. The most common ‘reason for not achieving good status’ is pollution from a variety of sources, dominantly agriculture and the water industry. How do we know how to target resources to fix this problem? A key principle underlying environmental policy is the ‘polluter pays’ principle. However, the big question that my collaborators and I have been working on is: how do we work out who the polluter is?
Why is it so hard to determine where pollution comes from?
In our recent paper published in Water Resources Research, Richard Barnes and I present a new approach to solve this problem. The approach is based on the idea of ‘inverse modelling’, which is widely used in fields like geophysics but not so much in environmental science. Our ‘inverse’ approach sharply contrasts with the dominant ‘forward’ approach which starts with an assumed set of sources and then predicts the resultant concentrations of pollutants in the river downstream (e.g., SAGIS). In my view, a huge & insurmountable challenge for forward models is that pollution sources cannot be known in advance and should not be assumed. There are many ‘known unknowns’ and uncertain sources (e.g., sewerage misconnections, diffuse pollution) that make forward modelling, and their predictions, extremely uncertain.
The solution
We sidestep these challenges by instead working backwards. We start with a set of nested observations of a pollutant in a river network and then determine the distribution of sources upstream that best explain the observations. In short, we ‘unmix’ the pollutant downstream to recover where it came from originally.
How does it work?
I made a video explainer of this approach above (alternative link here), but briefly, our approach is as follows. First, we represent the nested set of observations on a real river network as a simpler data structure: a ‘Directed Acyclic Graph’. This data-structure allows for very fast computational operations and allows us to simplify the mathematics considerably. Second, for now, we assume that the pollutant is well-mixed and conservative, in other words it isn’t removed from the water as it is transported downstream (e.g., by biological uptake). This allows us to model pollutant transport simply as a weighted mixture of nodes on the network, which is easy to compute. Finally, we build an optimisation problem which determines the distribution of sources in the network that best explain the observations. This is a very efficient algorithm and can be run on a laptop in a few seconds. Because the problem is mathematically ‘convex’ we can be sure that the solution we find is the optimal solution to the problem (notwithstanding limitations of the model & uncertainty of the data).
Open-source software
We’ve made an open-source python package that implements this approach freely available here. The package is designed to be user-friendly and can be applied to any nested set of observations of a conservative, well-mixed pollutant/tracer. Whilst I’ve been discussing pollution, the approach is very general and can be applied in a range of disciplines like geochemical exploration and hydrochemistry. Indeed, I initially developed this approach for application to sedimetnary geochemical datasets during my PhD (e.g., in Scotland and northern Australia).
The application
In our second paper, published in Science of the Total Environment, we apply this approach to the River Wandle, a chalk stream in SW London. This work was led by Kajetan Chrapkiewicz, working alongside Gareth Roberts, Leon Barron, Richard Barnes and myself, in a NERC funded project. The ecological status of the River Wandle is currently under significant scrutiny and the impacts of sewage pollution on the Wandle was the topic of a recent documentary.
Illegal pesticides!?
In 2023, Leon’s student Melanie Egli published a study detailing the amounts of different anthropogenic chemicals (including ‘familiar’ compounds such as cocaine, salycylic acid and morphine) across waterways in London. One of the key findings of this study was that rivers, including the Wandle, contained suprisingly high concentrations of the pesticide Imidacloprid. This was surprising because Imidacloprid is illegal to use on fields in the UK and so its presence in the river is somewhat of a surprise.
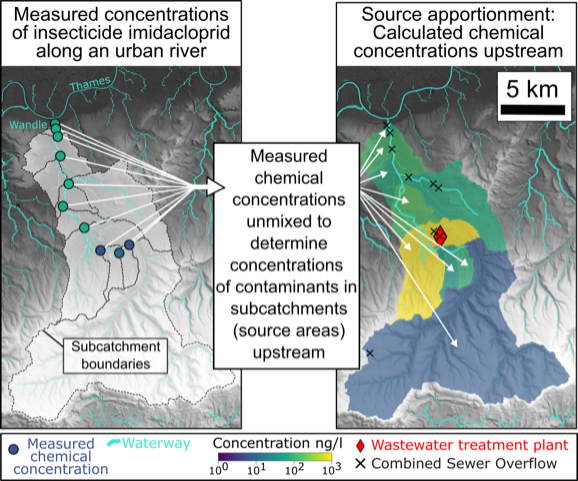
The map on the right shows our calculated source concentration of Imidacloprid. The map shows the highest source concentration the sub-catchment that contains the outflow of the Beddington wastewater treatment plant (red diamond). On the left shows the samples that were used to fit the model. Source: Chrapkiewicz et al. (2024)
In this study, we applied the new inverse method to the samples from the Wandle to determine where Imidacloprid enters the river. We found that, overwhelmingly, the Imidacloprid comes from one small part of the river that contains the out-flow of the Beddington Sewage Treatment Works. This was an interesting result because it suggests that Imidacloprid entering rivers through treated wastewater. Our result is therefore consistent with the proposal that Imidacloprid enters the sewage system after being applied to domestic pets to kill fleas (etc.), and then washed down drains but is not (yet) removed at treatment facilities (as described here).
The ‘fingerprints’ of pollution
By determining the sources of many different chemicals (e.g, cocaine, tramadol, salycylic acid) we could see if there were any other dominant pollution mechanisms. Using a technique called Principal Component Analysis we essentially identified the ‘fingerprint’ of different sources of pollution in the river. Alongside the treated waste-water source, we found a second source of pollution that was consistent with untreated waste-water which was associated with cocaine, benzoylecgonine (a cocaine metabolite), and salycylic acid (a metabolite of aspirin).
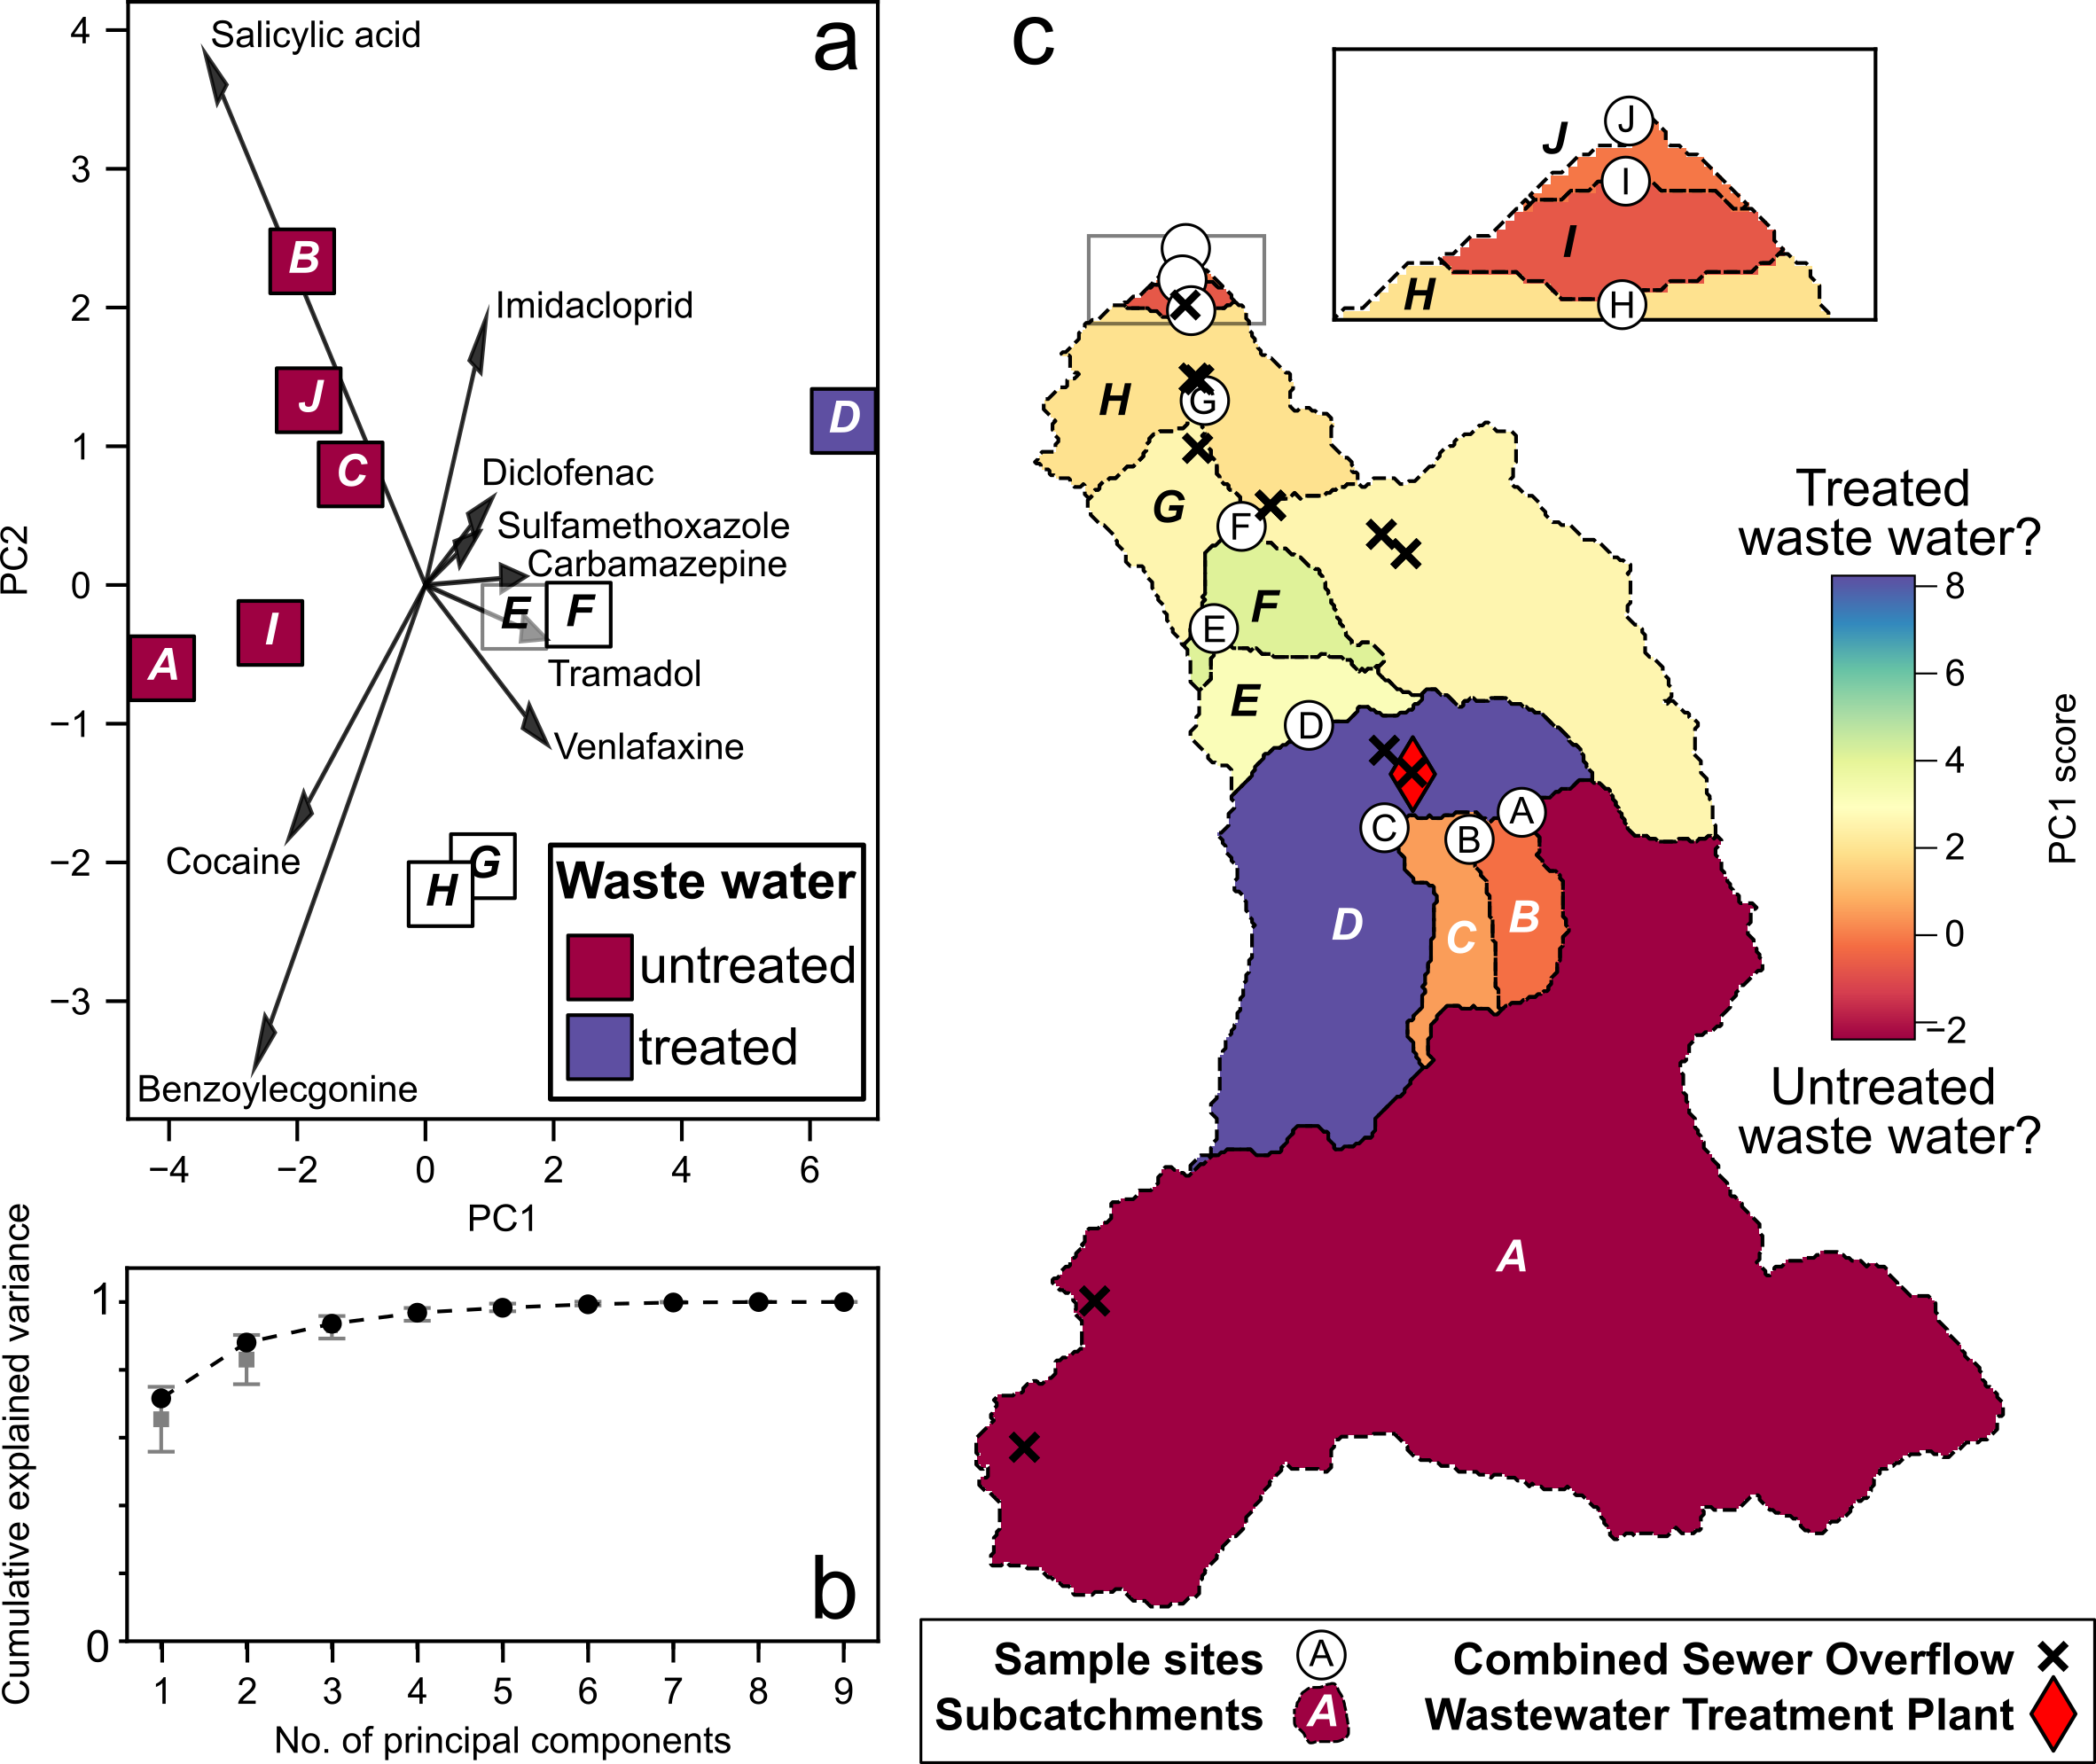 Determining the chemical ‘fingerprints’ of different pollution pathways into the River Wandle. Source: Chrapkiewicz et al. (2024)
Crucially, we were able to deduce these sources, and their locations, with very limited prior information. All we needed were a set of observations downstream, some knowledge of the river network and widely available information about locations of infrastructure. This is a key advantage of the inverse approach: it is data-driven and doesn’t require a priori knowledge of the sources.
The future
Whilst this work is in early-stages I see ‘inverse’ approaches like this as a key part of the future of water quality monitoring. In particular, inverse approaches are well placed to capitalise on growing quantities of real-time water quality sensor data, for instance, that which is mandated by the 2021 Environmental Act. Existing forward models are not well-suited to this kind of real-time data because they require extensive user calibration and parameterisation. In contrast, an inverse approach like ours could provide source apportionment ‘on the fly’ using real-time sensors.
Citizen scientists
Additionally, I foresee a potential use-case for this approach in the interpretation of citizen science datasets. Increasingly, public campaign groups are gathering information on pollutant levels across their local watersheds. Such data is often spatially dense (due to the use of low-cost sensors & enthusiastic community support) but temporally sparse. Our approach is well-suited to this kind of data because it can be run on a ‘snapshot’ of observations and benefits from a large spatial distribution. Additionally, the interpretation of the results is very intuitive, requires very limited prior information, and our open-source software can be run on a laptop in a few seconds. If you are a citizen scientist interested in this, please get in touch!
Wastewater Epidemiology
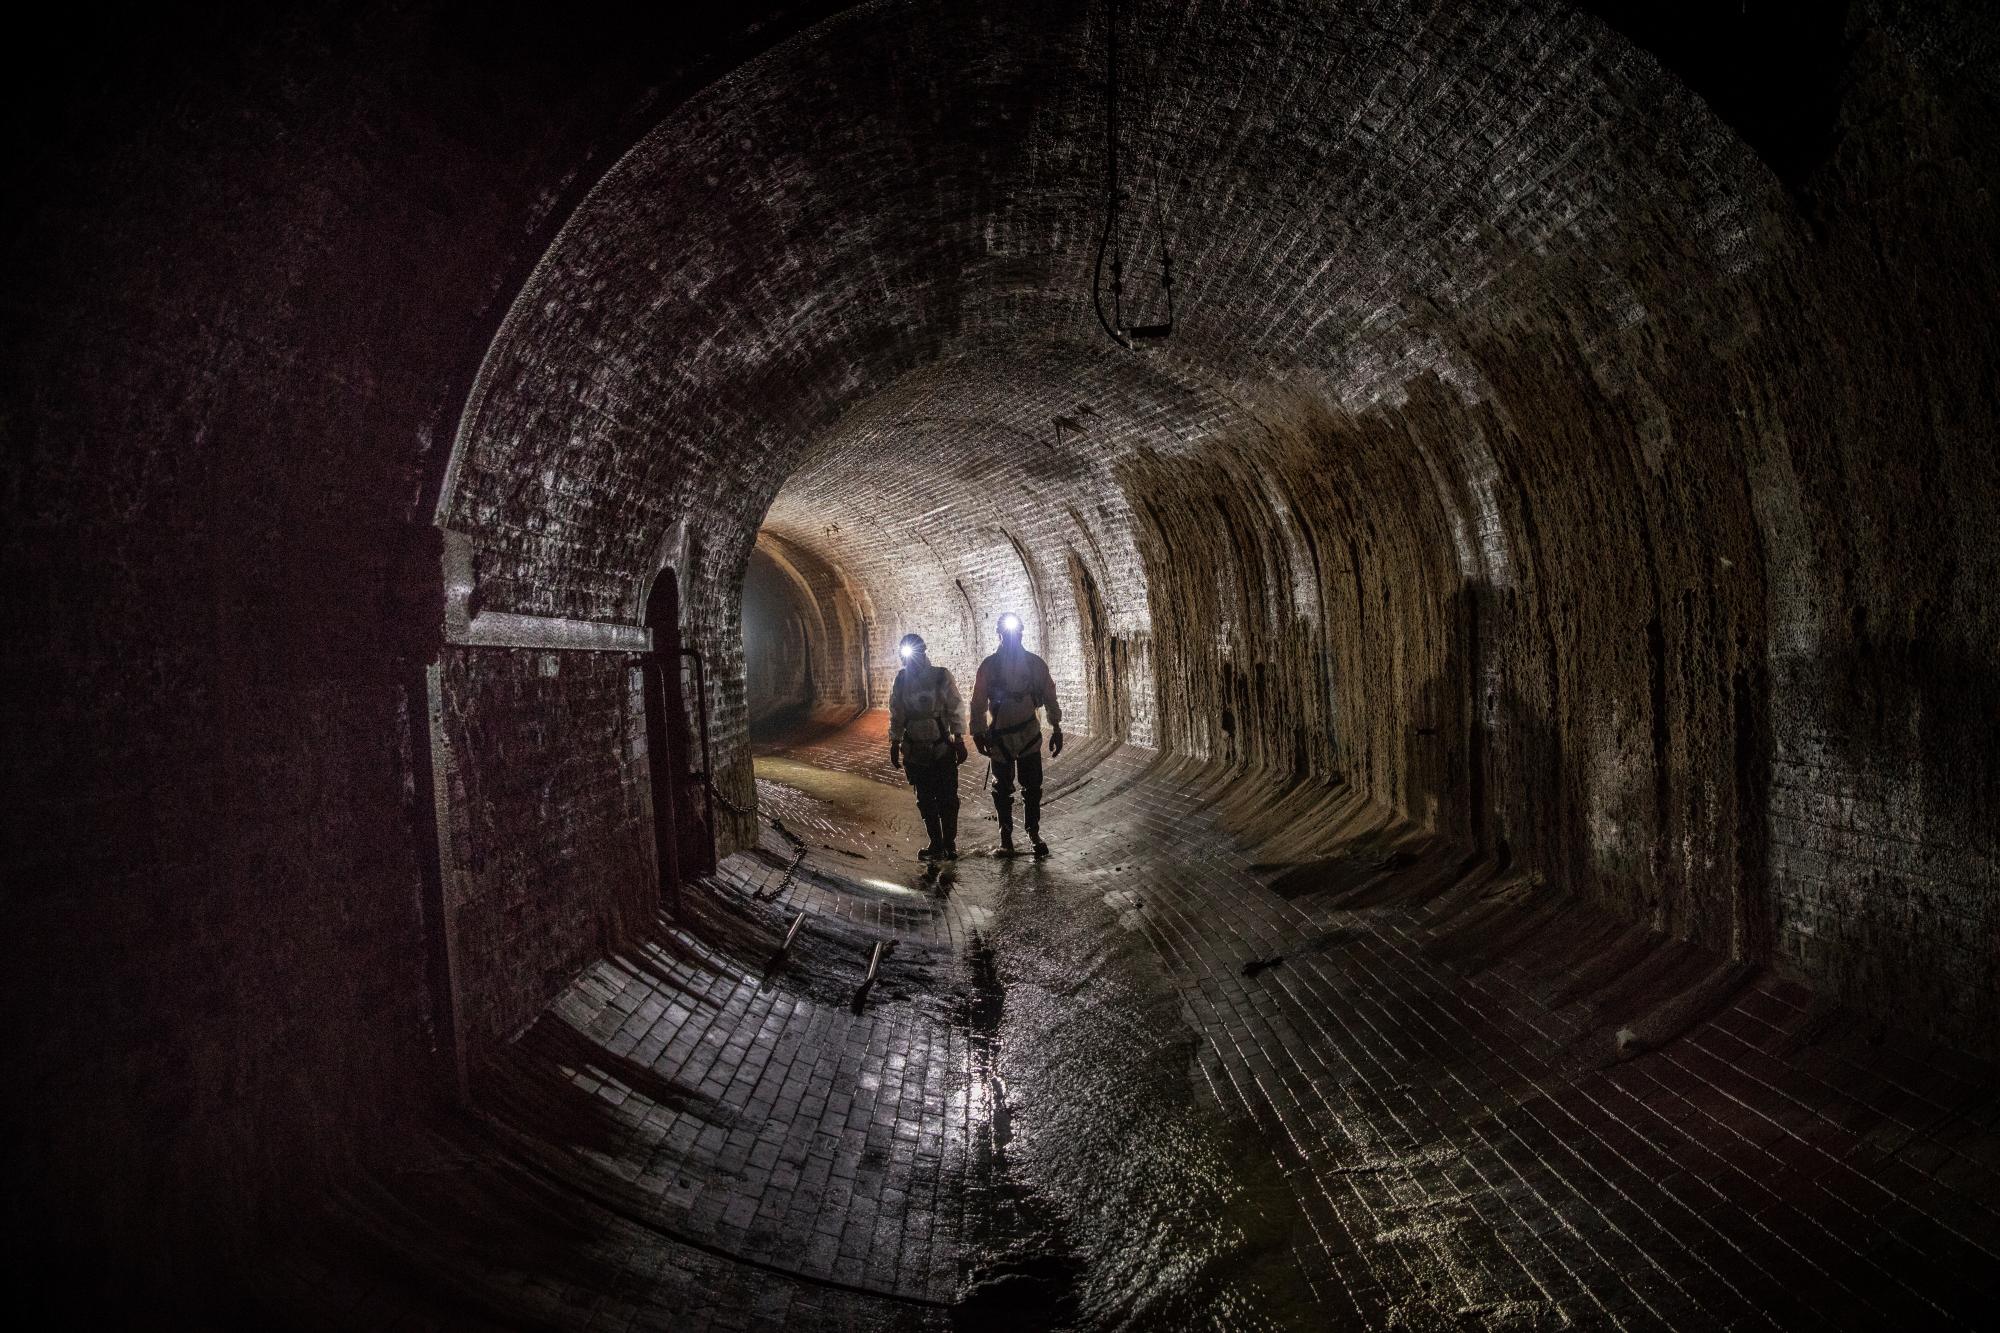 Sewerage networks like London’s (pictured) could be considered mathematically as equivalent to river networks (albeit presumably somewhat more unpleasant to sample). Source: David Levene/The Guardian
Finally, whilst I’ve mostly discussed river networks here, its worth noting that the approach is very general and can be applied to any kind of convergent network. In particular, I see a potential application in the field of ‘wastewater epidemiology’ where the sources of chemicals or disease tracers in sewerage systems are determined to understand the health of a population in a sewer-shed.
References
If you are interested in reading more about this work, the papers are available below, and I’m happy to discuss the work further.
Barnes & Lipp (2024) “Using convex optimization to efficiently apportion tracer and pollutant sources from point concentration observations”. Water Resources Research, 60, e2023WR036159. DOI: 10.1029/2023WR036159
Chrapkiewicz et al. (2024) “Apportioning sources of chemicals of emerging concern along an urban river with inverse modelling” Science of the Total Environment DOI: 10.1016/j.scitotenv.2024.172827